Coffee Industry Statistics 2026: The $263 Billion Shift

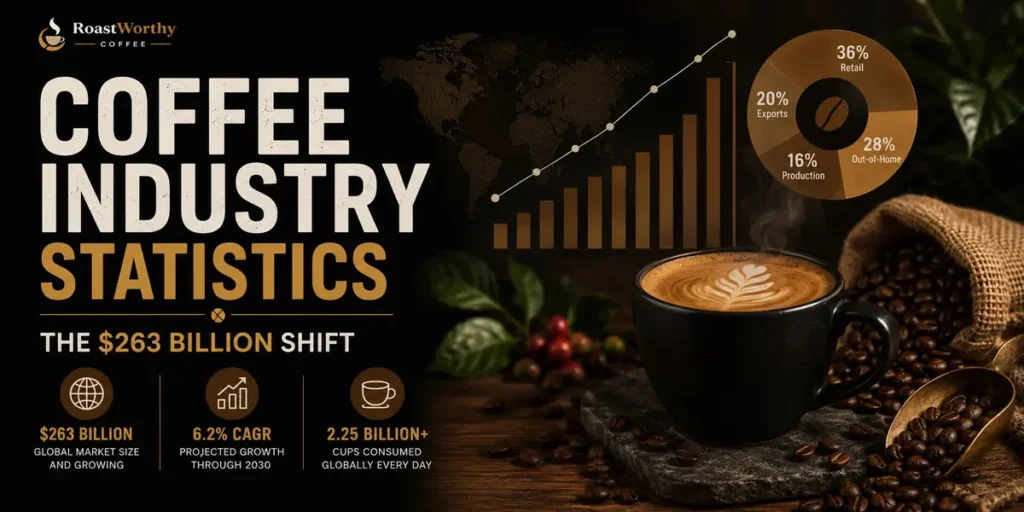
In January 2026, global coffee exports jumped 12.7% year on year. Robusta led the surge — up nearly 50%. Arabica fell 8%. That single month tells you more about where the coffee industry is heading than any market report.
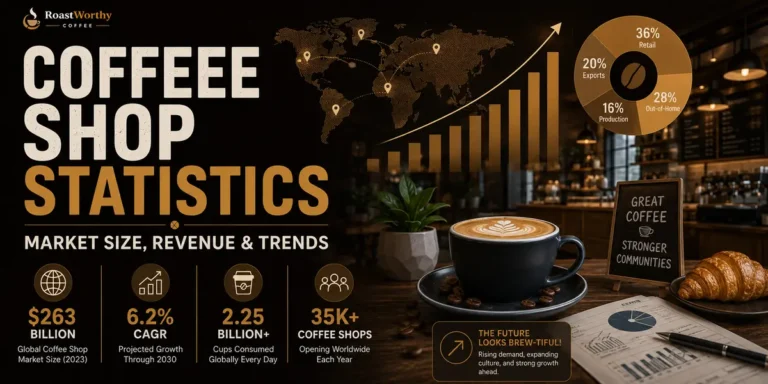
The world produced a record 178.8 million bags of coffee in the 2025/26 season. The global market crossed $263 billion in value. And the farmer who grew those beans still earned about 4% of what you paid for the finished product.
These coffee industry statistics don't paint a single picture. They paint two. An industry growing at 5.4% annually. And a supply chain that hasn't fundamentally changed in three decades. Both true. Both uncomfortable. ☕
How Big Is the Coffee Industry in 2026?
Depends on who's measuring.
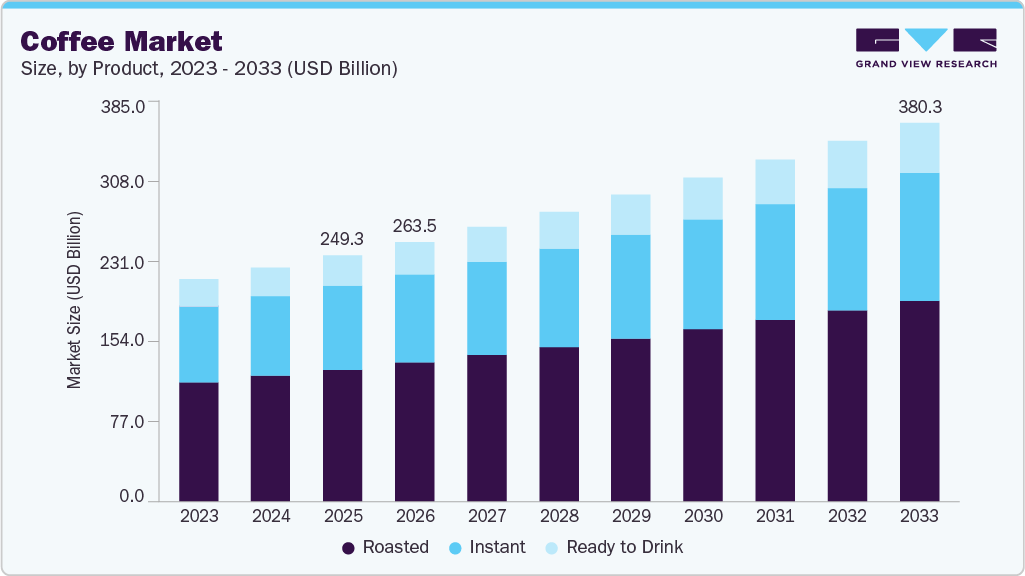
Grand View Research puts the global coffee market at $263.5 billion in 2026, projected to reach $380.3 billion by 2033. That's a 5.4% compound annual growth rate — one of the most consistent CAGRs in the beverage sector.
Mordor Intelligence lands lower at $185.69 billion for 2026, reaching $238.99 billion by 2031 at 5.18% CAGR. Their methodology excludes some retail and foodservice channels, which explains the gap.
Fact.MR goes broader — $300.5 billion. They include equipment, accessories, and institutional channels.
| Source | 2026 Valuation | Forecast Horizon | CAGR |
|---|---|---|---|
| Grand View Research | $263.5B | 2033: $380.3B | 5.4% |
| Mordor Intelligence | $185.69B | 2031: $238.99B | 5.18% |
| Fact.MR | $300.5B | 2036: Steady growth | ~5% |
| Coherent Market Insights | $153.02B | 2033: $214.16B | 4.9% |
| TechSci Research | $275.72B (2024) | 2030: $376.79B | 5.41% |
The disagreement on the headline number is less important than the agreement on direction. Every firm. Every methodology. Every forecast. Up.
What's pushing that growth isn't more people drinking coffee. It's people drinking more expensive coffee. Premiumization is the engine. Ready-to-drink formats are the accelerator. Emerging markets are the runway.
Coffee Production by Country: The 2025/26 Record
The USDA's December 2025 forecast put world coffee production at 178.8 million 60-kg bags for the 2025/26 season. A record. Up 3.5 million bags — roughly 2% — from the previous year.
But that record masks a geographic reshuffling that matters more than the headline number.
The top 10 producers
| Rank | Country | 2025/26 Output (M bags) | Primary Variety | YoY Change |
|---|---|---|---|---|
| 1 | Brazil | 63.0 | Arabica + Robusta | ↓ 2M |
| 2 | Vietnam | 30.8 | Robusta (95%) | ↑ Recovery |
| 3 | Colombia | 13.8 | Arabica | Flat |
| 4 | Indonesia | 12.45 | Robusta + Arabica | ↑ Record |
| 5 | Ethiopia | 11.56 | Arabica | ↑ Strong |
| 6 | Uganda | 6.88 | Robusta | ↑ Steady |
| 7 | India | 6.05 | Robusta + Arabica | Flat |
| 8 | Honduras | 5.80 | Arabica | Recovery |
| 9 | Peru | 4.20 | Arabica | Flat |
| 10 | Mexico | 3.90 | Arabica | Flat |
Brazil still produces over a third of the world's coffee. 63 million bags. But that number is down 2 million from the prior year, and the composition shifted dramatically.
Brazil's Arabica problem
Brazilian Arabica output fell by 6 million bags to 38 million. Severe drought and extreme heat in Minas Gerais and São Paulo — the heart of Brazilian coffee country — damaged blossoming, fruit setting, and cherry development.
This wasn't a bad harvest. This was climate economics showing up on a balance sheet.
Meanwhile, Brazil's Robusta (Conilon) harvest hit a record 25 million bags. Good rainfall in Espírito Santo and Bahia boosted yields. The world's largest Arabica producer is quietly becoming a major Robusta player.
That's adaptation, not coincidence. Robusta is hardier. More heat-tolerant. Cheaper to grow. As Arabica regions warm, Robusta fills the gap. The market is voting with its soil.
The Robusta Structural Shift
Robusta now accounts for roughly 42% of global coffee production. Five years ago, that number was closer to 35%.
This isn't a temporary blip driven by a single bad Brazilian Arabica harvest. Multiple forces are converging simultaneously — competitive pricing versus Arabica, increased demand from roasters adjusting blends, recovery in Vietnam and Indonesia, and climate-driven substitution in Brazil itself.
The implications go beyond supply economics. Robusta has roughly twice the caffeine content of Arabica. The flavour profile is different — earthier, heavier, less acidic, more bitter. The world's coffee is quietly changing what it tastes like.
Not everyone will welcome that. But markets don't care about preference. They care about price and availability.
Coffee Export Statistics: Who Ships What
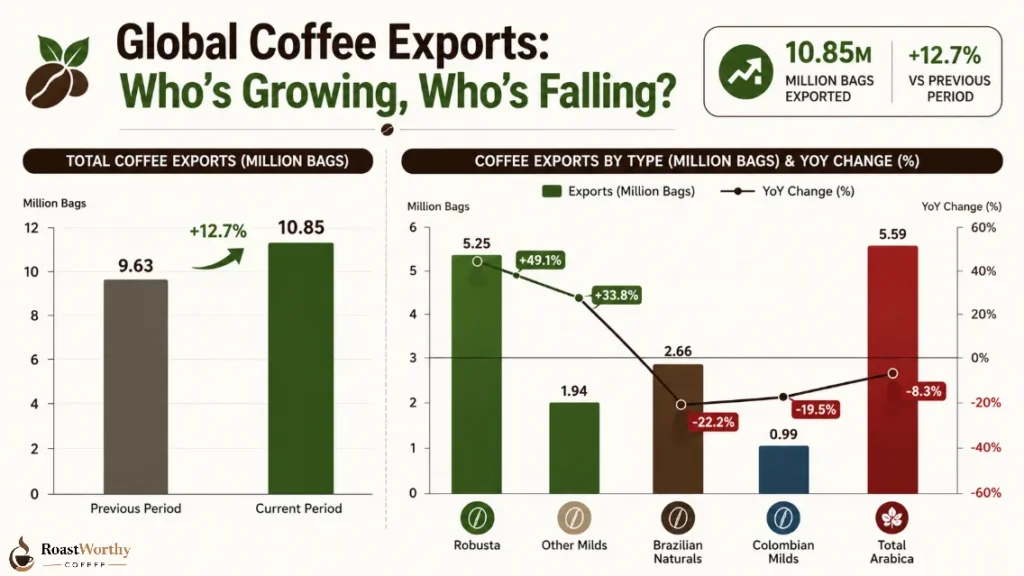
Global coffee exports in January 2026 reached 10.85 million bags of green beans. Up from 9.63 million in January 2025 — a 12.7% increase. Supply chains recovered. Production in key exporting countries rose.
But the aggregate conceals the most important shift in coffee trade in a decade.
| Category | Jan 2026 Exports (M bags) | YoY Change |
|---|---|---|
| Robusta | 5.25 | +49.1% |
| Other Milds | 1.94 | +33.8% |
| Brazilian Naturals | 2.66 | -22.2% |
| Colombian Milds | 0.99 | -19.5% |
| Total Arabica | 5.59 | -8.3% |
Robusta exports surged nearly 50%. Vietnam alone jumped 73.3% to 3.69 million bags. India, Indonesia, and Uganda combined added another 20.4%.
Arabica fell across every subcategory. Brazilian Naturals dropped 22%. Colombian Milds fell 19.5%. Total Arabica's share of global exports dropped from 66.4% to 61.1%.
This pattern held for three consecutive months through early 2026. That's not noise. That's structural realignment.
What the world actually exports
Green beans dominate: 85.23% of total coffee exports. Raw material. Unprocessed.
Soluble (instant) coffee accounts for 14.24%, up 19.6%. Vietnam, Indonesia, and Brazil lead. Demand for convenience products is growing even at the export level.
Roasted coffee: 0.53%. Down 56% from the prior year. Almost nobody exports roasted coffee. The value-add — roasting, grinding, packaging, branding — happens in consuming countries.
That's not an accident. It's the architecture of a supply chain that extracts raw material from producing nations and sells finished product back to them.
Coffee's Economic Footprint: The US Case
The NCA commissioned Technomic to measure coffee's economic footprint in the United States. The numbers, last updated in 2023, remain the most comprehensive assessment available.
The total economic impact: $343.2 billion. Up 52.4% since 2015.
That's not just café revenue. That's the entire chain — importing, roasting, manufacturing, distribution, retail, equipment, wages, and taxes. Coffee generates more US economic activity than many industries operating across all 50 states. And coffee can only be grown commercially in two — Hawaii and California.
Employment
The industry supports over 2.2 million US jobs. More than $100 billion in annual wages.
Those jobs aren't all baristas. Importers and brokers. Roasting facility operators. Truck drivers. Equipment manufacturers and repair technicians. Packaging engineers. Logistics coordinators. Marketing and retail staff.
Specialty disproportionately drives employment growth. A commodity roasting facility is highly automated — high volume, low headcount. A specialty roaster employs cuppers, profile developers, sourcing managers, and education staff. More jobs per pound of coffee roasted. And specialty is the segment that's growing.
Daily economic activity
US consumers spend more than $300 million on coffee products every day. Over $110 billion annually. That's not a beverage category. That's an economic sector with its own supply chain dynamics, employment base, and policy implications.
The Coffee Roaster Equipment Market
Roasting equipment has its own growth curve — and it's a leading indicator for the industry.
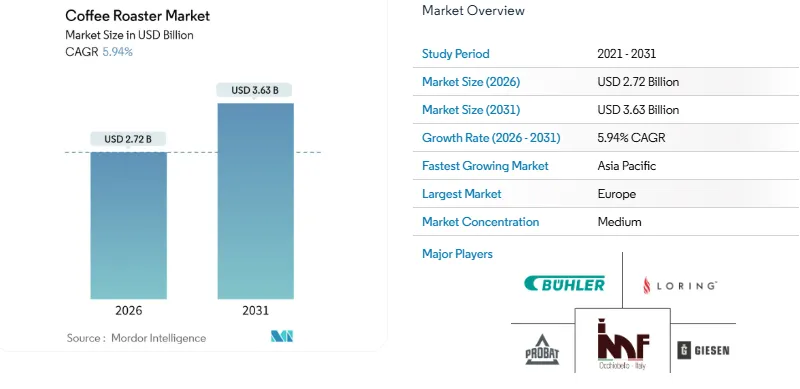
The global coffee roaster market was valued at $2.72 billion in 2026, growing at 5.94% CAGR to reach $3.63 billion by 2031, according to Mordor Intelligence.
Fortune Business Insights projects a slightly different trajectory — $2.06 billion in 2026 to $3.41 billion by 2034 at 6.46% CAGR.
Research and Markets is the most aggressive: $1.72 billion to $2.99 billion by 2032 at 9.4% CAGR. Their higher growth rate likely captures the small-batch and home-roasting equipment boom.
The major players building the world's roasting capacity: Bühler AG, Giesen Coffee Roasters, Loring Smart Roast, IMF, and PROBAT.
These are the machines that turn green beans into product. When roasting capacity expands, consumption follows. New installations mean someone expects to sell more coffee.
Regional Industry Dynamics
North America leads in premium adoption, cold brew innovation, and sustainability investment. The US specialty coffee market share sits at roughly 25% and climbing. Home equipment ownership is at record levels. E-commerce is reshaping how beans reach consumers.
Europe sets the global sustainability benchmark. EU deforestation regulations (EUDR) are forcing supply chain traceability that will reshape sourcing.
European roasters are ahead on carbon-neutral roasting, recycling infrastructure, and packaging innovation. The regulatory environment is tighter than anywhere else — and that's driving industry-wide change.
APAC is the volume growth engine. Urbanization, rising middle-class incomes, and western lifestyle adoption are converting tea cultures. South Korea's café scene is among the world's most saturated.
China's per-capita consumption is still tiny — but with 1.4 billion people, small shifts move global numbers. Japan remains the world's fourth-largest consuming nation.
Producing regions are seeing increased domestic consumption. Brazil, Vietnam, and Ethiopia are all drinking more of their own coffee. This creates a fascinating dynamic — export-dependent economies building internal markets that could eventually reduce export availability.
The Supply Chain Economics (Where the Money Actually Goes)
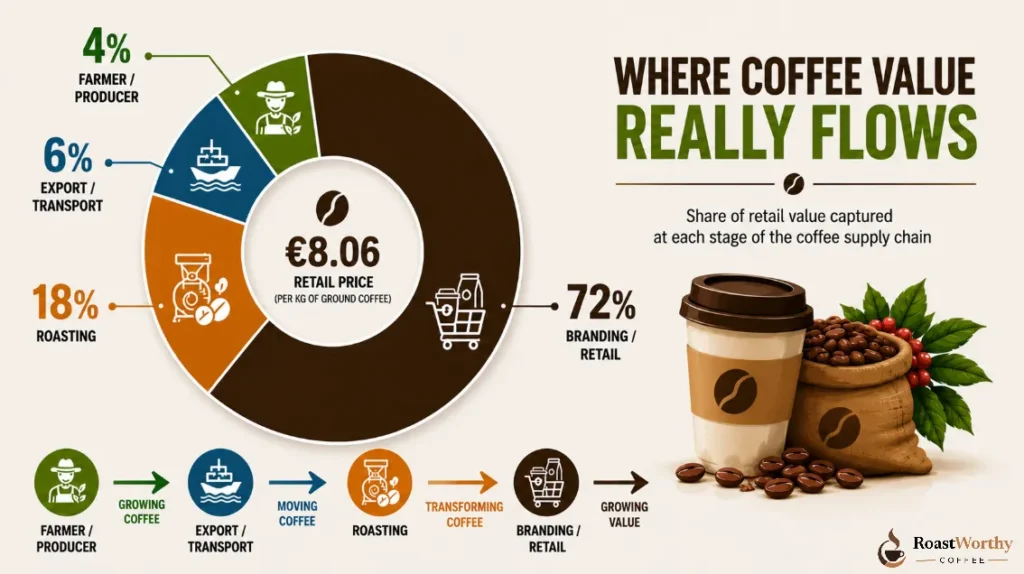
Here's where the numbers should make you uncomfortable.
The 2026 Coffee Barometer — published by a consortium including Conservation International and Solidaridad — examined the structural economics of the global coffee value chain. The findings haven't improved.
The value distribution problem
There are 12.5 million coffee-producing families worldwide. Most do not earn a living income.
A kilogram of ground coffee retails for approximately €8.06 on a German supermarket shelf. Of that, €0.41 reaches the producer. Roughly 4%.
The share of final retail value remaining in producing countries has fallen from about 30% in the early 1990s to roughly 10% today. This happened while global production volumes nearly doubled. More coffee. Less value captured at the source.
| Supply Chain Stage | Approx. Share of Retail Value |
|---|---|
| Farmer / producer | ~4% |
| Export / import / transport | ~6% |
| Roasting | ~15–20% |
| Branding / packaging / retail | ~70–75% |
Value concentrates downstream. Always has. The roasting, branding, and retail end — almost entirely in consuming nations — captures the majority. The growing end — in producing nations — captures the smallest fraction.
The unpaid labor subsidy
The Barometer's most damning finding: the coffee sector is structurally subsidized by unpaid family labor. If that labor were valued at local minimum wage, production costs would exceed the selling price for a significant percentage of farmers.
In plain terms: coffee is only affordable because millions of farming families work for free. The system depends on their unpaid labor to keep retail prices where consumers expect them.
Two decades of sustainability programs
Fair Trade. Rainforest Alliance. UTZ. Direct trade. Corporate sustainability initiatives. NGO partnerships. Certification schemes.
The Barometer concludes that none of these have fundamentally altered the industry's value distribution. They've created premiums at the margin. They've improved conditions for some farmers in some regions. But the core economics — value concentrated downstream, labor subsidized upstream — remain structurally unchanged.
This matters beyond the flavour. The people who grew this deserve more than 4%.
Who Owns the Coffee Industry
The competitive landscape shows moderate consolidation at the top and a long tail of differentiation below.
Nestlé S.A. — the world's largest coffee company by revenue. Nespresso, Nescafé, and Starbucks at-home products give them presence across every price tier and format. Their scale is unmatched.
Starbucks Corporation — the dominant café brand globally. Vertically integrated from bean sourcing to retail cup. Their reserve roasteries and premiumization push signal where they see the market heading.
JDE Peet's — Jacobs Douwe Egberts merged with Peet's Coffee. Massive European retail presence with a growing US specialty footprint through Peet's.
Luigi Lavazza S.p.A. — Italy's largest coffee company. Strong European retail and foodservice. Expanding into premium and single-serve.
The Kraft Heinz Company — Maxwell House and commodity brands. Volume play. Not specialty.
The dynamic splits cleanly. Global conglomerates leverage scale, distribution networks, portfolio diversity, and regulatory readiness. Specialty brands differentiate through authenticity, direct consumer relationships, and quality — but face pressure from corporate-acquired “specialty” brands with deeper pockets.
The middle is getting squeezed. Independent mid-size roasters compete against commodity-scale players on volume and against corporate-owned specialty brands on quality. Survival requires either genuine differentiation or niche market depth.
Investment and Consolidation Trends
M&A activity through 2025 and into 2026 focused on three areas.
RTD brands. Major beverage companies acquired cold brew and RTD coffee startups. The motive was distribution — convenience-store and grocery-channel access to the fastest-growing format segment. Expect more of this.
Specialty roasters. Conglomerates acquired mid-size specialty roasting companies to access premium consumers and direct-trade supply relationships. The pattern: acquire the brand, retain the founders, scale the distribution. The founders get capital and reach. The acquirer gets credibility and supply access.
Technology platforms. Subscription services, bean-to-cup machine manufacturers, supply chain tracking platforms, and AI-driven demand forecasting tools attracted venture and private equity investment. Coffee is being digitized — from sourcing to roasting to the consumer's cup.
Climate Impact on the Industry
This is no longer a future risk. It's a present production problem with quantified losses.
Brazil's 6 million bag Arabica decline in a single season is the most visible example. But the issue is systemic across the coffee belt.
Arabica requires specific temperature ranges and altitudes — typically 15–24°C at 800–2,200 meters elevation. As temperatures rise, suitable zones shift uphill. Eventually, they shift off the mountain.
Some projections suggest up to 50% of land currently suitable for Arabica could become unsuitable by 2050. That's a 25-year runway. The industry is responding, but the scale of the challenge outpaces the response.
Current adaptation efforts include climate-resilient Arabica variety breeding, Robusta expansion into former Arabica zones, agroforestry and shade-grown systems, blockchain and IoT supply chain traceability, carbon-neutral roasting commitments, and direct farmer income programs beyond certification premiums.
Whether these efforts can offset the structural economics and climate trajectory simultaneously is the defining question for the next decade of coffee.
FAQ: Coffee Industry Statistics 2026
What is the global coffee market worth in 2026?
The global coffee market is valued at ~$263.5B in 2026 (Grand View Research), projected to reach $380.3B by 2033 at 5.4% CAGR. Estimates range from $153B to $300B depending on methodology.
How much coffee does the world produce annually?
World coffee production for 2025/26 is forecast at a record 178.8 million 60-kg bags (USDA). Brazil leads with 63M bags, followed by Vietnam (30.8M) and Colombia (13.8M).
How many people work in the coffee industry?
In the US alone, coffee supports over 2.2M jobs and generates $100B+ in annual wages (NCA/Technomic). Globally, ~12.5M families are involved in coffee production.
What percentage of coffee is Robusta?
Robusta accounts for ~42% of global production as of 2026, up from ~35% five years ago. Robusta exports surged 49.1% in Jan 2026 while Arabica exports fell 8.3%.
How much of the retail coffee price goes to farmers?
Roughly 4%. A kg of ground coffee sold for €8.06 on a European shelf returns ~€0.41 to the producer (2026 Coffee Barometer). Producing nations' share has dropped from 30% to ~10% since the 1990s.
How is climate change affecting coffee production?
Brazil's Arabica output fell 6M bags in 2025/26 due to drought and extreme heat. Some projections suggest 50% of Arabica-suitable land could become unsuitable by 2050.
Who are the biggest companies in the coffee industry?
Nestlé S.A. (Nespresso, Nescafé) is the largest by revenue. Other majors include Starbucks, JDE Peet's, Luigi Lavazza, and Kraft Heinz. The market shows moderate consolidation.
How big is the coffee roasting equipment market?
The global coffee roaster market was valued at $2.72B in 2026, projected to reach $3.63B by 2031 at 5.94% CAGR (Mordor Intelligence). Key players include Bühler, Giesen, Loring, and PROBAT.
The Coffee Industry in One Frame
The coffee industry in 2026 is a paradox. Growing at 5.4% annually while the people who grow the product earn 4% of its value. Producing record volumes while the geography of production shifts beneath it. Premiumizing while Robusta — the cheaper, harsher variety — gains share.
The market is healthy. The system that feeds it isn't. Both facts coexist. Neither cancels the other.
If you work in coffee — roasting, sourcing, selling, or just drinking it seriously — these numbers are your operating environment. Understanding them isn't optional. It's the difference between reading the market and getting read by it. ✒️
More Recommendations from RoastWorthy Coffee