Coffee Consumption Statistics 2026: What the Numbers Actually Say

Let's be honest. Most coffee consumption statistics articles are recycled numbers from 2019 with a new date slapped on top.
This isn't that.
These are the newest coffee consumption statistics as of 2026. Pulled from the Spring 2026 National Coffee Data Trends report, the USDA's December 2025 world trade data, the International Coffee Organization, and Grand View Research's June 2026 market analysis. Real numbers. Recent numbers.
And some of them are genuinely surprising.
Two out of three American adults now drink coffee every single day. That's the highest rate in over 20 years. Specialty coffee just overtook traditional coffee for the first time in history. And 82% of all coffee drinkers brew at home — a number that hasn't budged since the pandemic rewired our habits.
The curve is moving. Let me show you exactly where. ☕
Key Coffee Consumption Statistics (2026 At a Glance)
Short version for the people who want the headline numbers and nothing else.
Now the detail. Because the headline stats hide the interesting part.
Global Coffee Consumption: The Big Picture
Coffee is the second most consumed beverage on earth. Only water beats it. Not tea. Not soda. Not beer. Water and coffee.
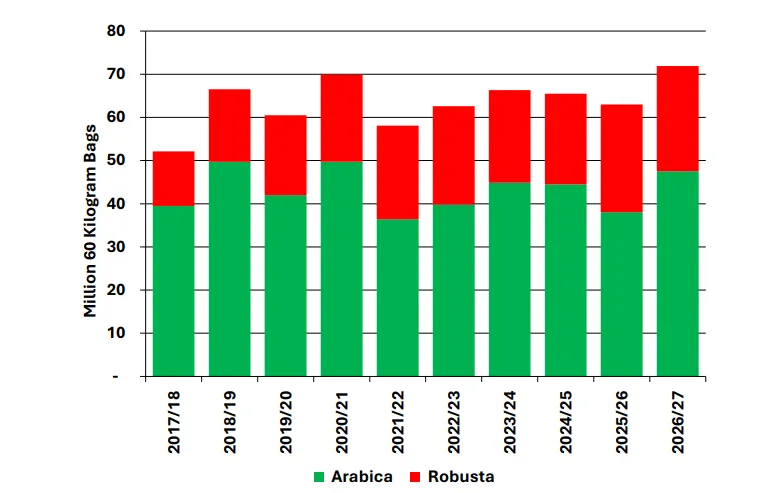
World consumption for the 2025/26 coffee year hit 173.85 million 60-kg bags. That's a record. Up 1.3% year on year, according to the USDA's December 2025 Coffee: World Markets and Trade report.
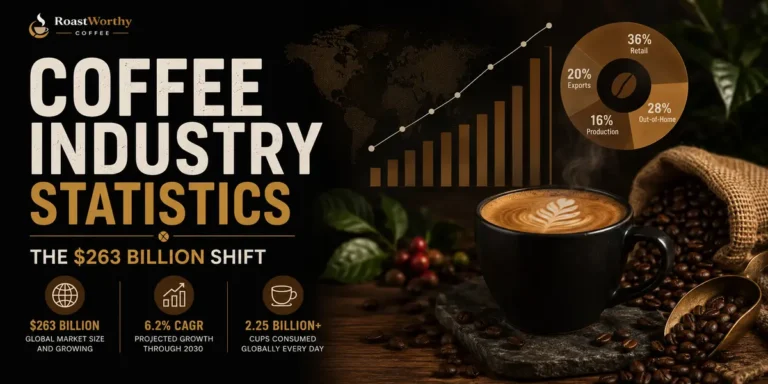
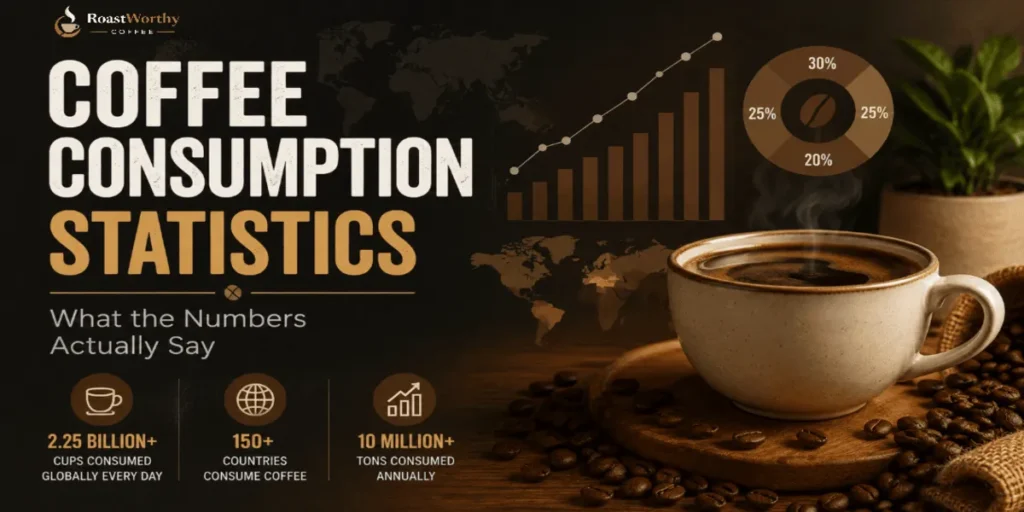
Translate that into human terms. Roughly 2.25 billion cups of coffee consumed globally. Every. Single. Day.
And it's still climbing. Despite price volatility in 2024 and 2025. Despite inflation pushing green coffee costs to historic highs. Despite climate pressure on Brazil and Vietnam — the world's two largest producers. Demand held.
That resilience tells you something fundamental about coffee. It's not a luxury people cut first. It's the last thing they give up. When household budgets tighten, people don't stop drinking coffee. They change how they drink it. They brew at home instead of buying a $7 latte. They buy beans instead of pods. But they keep drinking.
Who Drinks the Most in Total Volume
Total volume and per-person consumption are different stories. The biggest total consumers aren't the most obsessive per capita.
| Rank | Market | Total Consumption (60-kg bags) |
|---|---|---|
| 1 | European Union | ~41.9 million |
| 2 | United States | ~26.6 million |
| 3 | Brazil | ~22.3 million |
| 4 | Japan | ~7.5 million |
| 5 | Philippines | ~4.9 million |
The EU leads total volume because it's a bloc of 27 countries. The US leads as a single nation. Brazil is fascinating — it's both the world's largest producer and its third-largest consumer.
But total volume tells you about population size. Per capita tells you about culture. And per capita is where it gets interesting.
Coffee Consumption by Country: Per Capita Leaders
The countries that drink the most coffee per person aren't the ones you'd guess. They're not Italy. They're not France. They're not even the US.
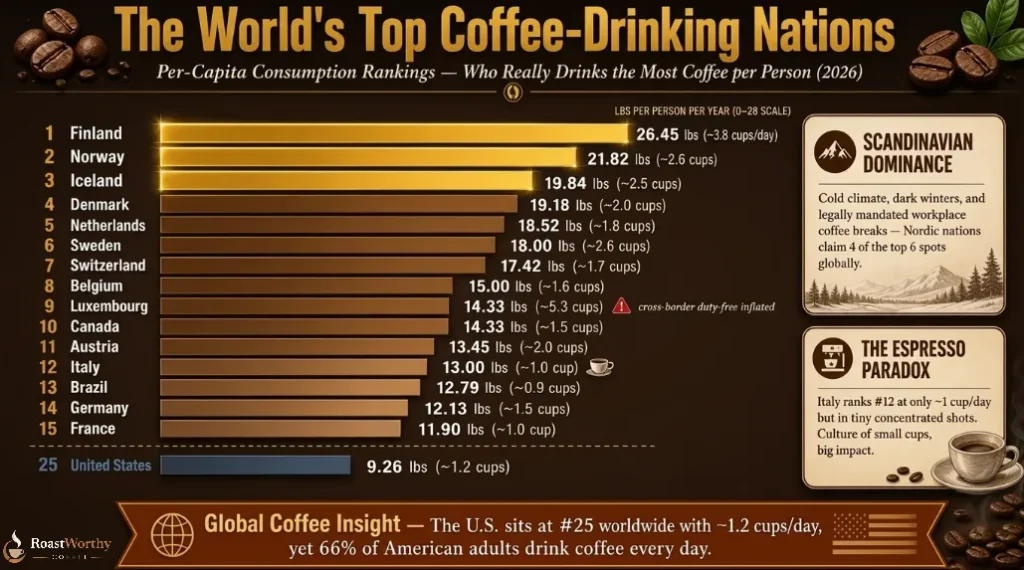
Scandinavia runs the table. Finland drinks nearly four cups per person per day. Four. The cold, the dark winters, the legally mandated workplace coffee breaks — it all adds up.
Here's the top 15 by per-capita consumption, based on 2026 data:
| Rank | Country | Lbs per Person/Year | Approx. Cups/Day |
|---|---|---|---|
| 1 | Finland | 26.45 | ~3.8 |
| 2 | Norway | 21.82 | ~2.6 |
| 3 | Iceland | 19.84 | ~2.5 |
| 4 | Denmark | 19.18 | ~2.0 |
| 5 | Netherlands | 18.52 | ~1.8 |
| 6 | Sweden | 18.00 | ~2.6 |
| 7 | Switzerland | 17.42 | ~1.7 |
| 8 | Belgium | 15.00 | ~1.6 |
| 9 | Luxembourg | 14.33 | ~5.3 |
| 10 | Canada | 14.33 | ~1.5 |
| 11 | Austria | 13.45 | ~2.0 |
| 12 | Italy | 13.00 | ~1.0 |
| 13 | Brazil | 12.79 | ~0.9 |
| 14 | Germany | 12.13 | ~1.5 |
| 15 | France | 11.90 | ~1.0 |
| 25 | United States | 9.26 | ~1.2 |
A few things jump out.
Luxembourg at 5.3 cups a day looks absurd. It's partly a statistical artifact — cross-border workers buy duty-cheap coffee in Luxembourg and drink it in France, Germany, and Belgium. The honest residents-only leader is Finland.
Italy at 13 lbs and roughly one cup a day? That's espresso culture. Tiny cups, high concentration, low volume. They drink less by volume but it hits harder.
The United States sits at 25th per capita. One-and-a-quarter cups a day. That sounds low for a country that runs on coffee. But remember — 66% of adults drink it daily. The per-capita number includes non-drinkers. Among actual coffee drinkers, the average is 2.8 cups a day.
The regional growth story
North America and EMEA are mature markets. Growth there is about trading up, not drinking more. People shift from instant to filter. From pre-ground to whole bean. From blonde roast to single-origin.
APAC and Latin America are the volume growth story. Traditional tea cultures are converting. South Korea's coffee consumption has exploded. China's per-capita is still tiny — 0.2 to 0.3 cups a day — but with 1.4 billion people, even small shifts move global numbers.
India sits near the bottom at 0.02 to 0.1 cups per day. But cafe culture is spreading fast in cities. That's a multi-decade growth runway.
That's where the next 20 million bags come from. Not the saturated West.
US Coffee Consumption Statistics 2026
This is the section with the freshest data. And the most dramatic shifts.
Daily coffee consumption among American adults reached a 20-year high in 2026. 66% drank coffee in the past day. 73% in the past week.
That's a 37% jump since 2004.
Nearly 195 million American adults drink coffee every week. It's officially America's most popular beverage. Not soda. Not bottled water. Not juice. Coffee has held the top spot continuously in NCA tracking that dates back to 1950.
The Spring 2026 NCDT report surveyed 1,850 nationally representative adults between January 5 and January 20, 2026. Every respondent had consumed a beverage other than tap water in the previous day. This isn't a guess or an extrapolation. It's measured.
How many cups Americans actually drink
That 4% — the six-plus-cup crowd — are either very productive or very anxious. Possibly both.
The 2.8-cup average has been remarkably stable. What's changed is the type of coffee in those cups. Which brings us to the biggest shift in the data.
The Specialty Coffee Takeover
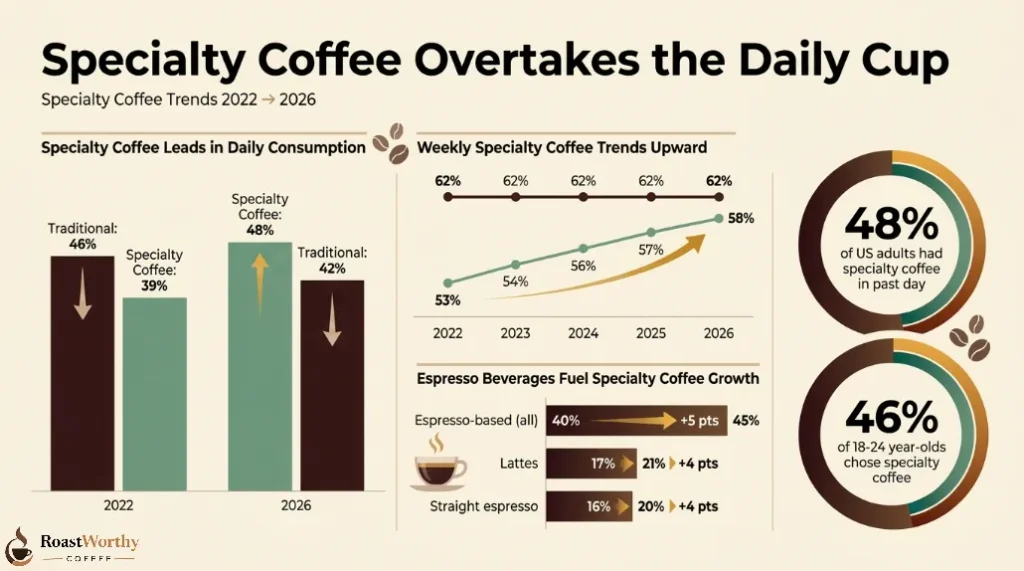
Here's the headline nobody saw coming. For the first time ever, specialty coffee beat traditional coffee in past-day consumption.
48% of US adults had a specialty coffee in the past day. Traditional? 42%.
That gap didn't exist a few years ago. In 2022, traditional still led. Now specialty is ahead, and the gap is widening.
Past-week specialty consumption climbed to 58% in 2026, up from 53% in 2022. That's a 9.4% increase in four years. Meanwhile, traditional coffee stayed completely flat at 62% past-week.
The direction is obvious. People aren't drinking more coffee so much as drinking better coffee. The total volume is stable. The quality is climbing.
Espresso is driving the whole thing
Dig into the specialty numbers and one category does the heavy lifting. Espresso-based drinks.
| Beverage | 2022 Past-Week | 2026 Past-Week | Change |
|---|---|---|---|
| Espresso-based (all) | 40% | 45% | +5 pts |
| Lattes | 17% | 21% | +4 pts |
| Straight espresso | 16% | 20% | +4 pts |
Lattes and straight espresso. That's the growth engine.
Americans bought espresso machines during the pandemic and never put them away. The home barista is now a real, measurable demographic. People who own a Gaggia Classic or a Bambino Plus and pull a shot every morning before work.
Among 18–24-year-olds specifically, 46% had a specialty coffee drink in the past day. That's nearly half of young adults choosing specialty over traditional. The generational handwriting is on the wall.
What “specialty” actually means here
The NCA defines specialty coffee as espresso-based beverages (lattes, cappuccinos, macchiatos, straight espresso), non-espresso-based gourmet beverages (cold brew, iced coffee, frozen blended), and gourmet traditional coffee (beans from a specialty roaster, not commodity grade).
So the shift isn't just about lattes. It's about the entire category of better coffee. People moving from commodity pre-ground to freshly roasted beans. From instant to pour-over. From gas-station coffee to direct-trade single-origin.
If you take coffee seriously, this is the most encouraging number in the entire dataset.
At-Home vs Out-of-Home Consumption
The pandemic rewired coffee habits permanently. Some changes reverted. This one didn't.
82% of past-day coffee drinkers had their coffee prepared at home.
Only 28% had coffee prepared away from home.
That gap is massive. The kitchen won. The café didn't die — 28% is still tens of millions of people — but home brewing is where the volume lives.
Home coffee consumption has been rising annually, up over 10% since 2017. And it's not just drip machines. The growth is in better equipment — espresso machines, burr grinders, pour-over setups, French presses.
Over half of Brits now own a coffee machine. 22% own pod machines. 15% own espresso machines. 10% own bean-to-cup machines. And 53% of Brits say they've stopped spending money on coffee-shop visits since investing in home equipment.
That's a structural shift, not a fad. When someone buys a $300 espresso machine and learns to pull a decent shot, they don't go back to paying $6 at a café. The math is too obvious. A double shot of espresso costs about 40 cents in beans. A latte at a café costs $5 to $7. The payback period on home equipment is measured in weeks.
The RTD boom
Ready-to-drink coffee is the fastest-growing format globally. The RTD coffee market is projected to reach $59.9 billion by 2036, growing at a 4.1% CAGR.
Cold brew in a can. Nitro on tap at home. Oat milk lattes in the grocery aisle. Convenience without the café markup.
RTD bridges the gap between home and away. It's not brewing at home, but it's not a café visit either. It's grab-and-go quality — and it's eating into both categories.
Coffee Consumption by Generation
Age tells a story here. And it's not the one you'd expect.
You'd think Gen Z — the most caffeinated, Instagram-driven generation — would be the biggest coffee drinkers. They're not. Not even close.
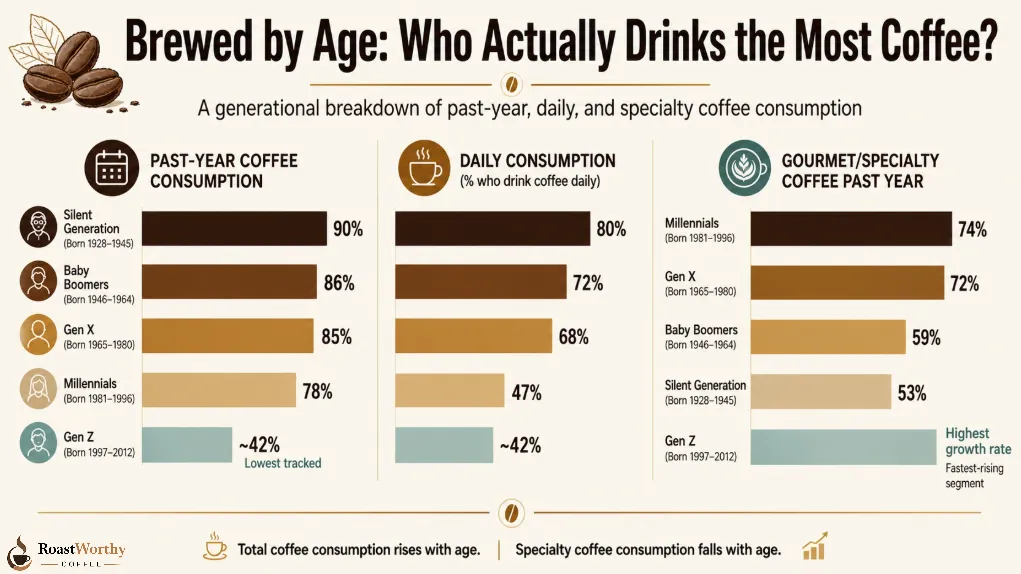
63% of Gen Z don't drink coffee at all. That's almost double the percentage of Millennials who abstain (33%). Even among Gen Z members who do drink coffee, most do so lightly — only 4% drink 3–4 cups a day, four times less than any other generation.
Coffee consumption skews older. Much older.
| Generation | Past-Year Consumption | Daily Consumption | Gourmet/Specialty (Past Year) |
|---|---|---|---|
| Gen Z | Lowest tracked | ~42% daily | Highest growth rate |
| Millennials | 78% | 47% | 74% |
| Gen X | 85% | 68% | 72% |
| Baby Boomers | 86% | 72% | 59% |
| Silent Generation | 90% | 80% | 53% |
Total consumption goes up with age. Specialty consumption goes down.
Older drinkers grew up with drip coffee. A pot on the counter. Black. Morning only. They've been drinking it for decades and they're not switching to cold brew.
Younger drinkers — when they do drink coffee — skew heavily toward specialty. Espresso-based drinks. Iced formats. Flavored lattes. Cold brew.
The generational split explains both sides of the market. Traditional coffee's flat numbers are held up by older drinkers who aren't switching. Specialty's growth is driven by younger drinkers entering the category and choosing quality from the start.
As Gen Z ages into peak coffee-consumption years (typically late 20s through 50s), expect the specialty share to keep climbing. That's not speculation. That's demographics doing what demographics do.
The gender split
Men drink more coffee than women — at least in the US. Roughly 50.8% of men versus 32.8% of women report regular coffee consumption. The gap narrows for specialty drinks, where female consumption is closer to male rates.
One study of young adults found that men consumed coffee significantly more frequently than women, and that consumption peaked in the 19–30 age bracket. Smokers also drank significantly more coffee than non-smokers. And people sleeping 3–5 hours a night consumed more coffee than well-rested individuals. None of that is surprising. But it's worth knowing.
Coffee Spending Statistics
People are drinking more coffee. They're also paying more for it.
The average American spends about $325 per year on coffee. That includes beans, pods, café visits, and RTD purchases combined.
Inflation has pushed the average café cup price up 23% over the last three years. A latte that cost $4.50 in 2022 now runs $5.50 or more in most cities. Yet total coffee spending hasn't dropped. Consumers are reallocating, not retreating.
The shift is visible in where the money goes. Less on café visits. More on home equipment and better beans. The $325 average includes someone buying a $200 espresso machine in January and then spending $15 a week on beans for the rest of the year. That's a very different spend profile than daily café visits — but the annual total looks similar.
Coffee generates roughly $85 billion in US annual revenue and contributes an estimated $343 billion to the US economy when you factor in the entire supply chain — from importers and roasters to equipment manufacturers and café payroll.
That's not a beverage category. That's an economic sector.
The Brazil Anomaly
Here's a number that bucked every global trend.
Brazilian per-capita household coffee consumption fell 2.2% in 2024 and a further 3.9% in 2025. According to ABIC (the Brazilian Coffee Industry Association), this is the first sustained decline in three decades.
The cause? Record retail prices. Brazil is the world's largest producer, but domestic prices still climbed because of export demand and supply chain pressure. Brazilians — who drink coffee like Americans drink water — actually cut back.
This matters beyond Brazil. It proves coffee consumption can decline under sufficient price pressure. It also shows that even producing nations aren't immune to the economics of their own crop.
If Brazil — a country where coffee is cultural bedrock — can see a decline, then price sensitivity is real. It's just that in most markets, the habit is strong enough to absorb the increases. For now.
FAQ: Coffee Consumption Statistics 2026
How much coffee is consumed daily worldwide?
Approximately 2.25 billion cups of coffee are consumed globally every day. Total world consumption reached a record 173.85 million 60-kg bags in 2025/26, up 1.3% YoY (USDA).
What percentage of Americans drink coffee?
66% of US adults drank coffee in the past day and 73% in the past week as of Spring 2026 — the highest daily rate in 20+ years. That equals ~195 million weekly drinkers.
Is specialty coffee more popular than regular coffee now?
Yes. 48% of US adults had specialty coffee in the past day vs. 42% for traditional — the first time specialty has overtaken traditional in NCA's 76-year tracking history.
Which country drinks the most coffee per capita?
Finland leads at ~26.45 lbs per person/year (~3.8 cups/day). Norway, Iceland, Denmark, and the Netherlands round out the top five. The US ranks 25th per capita.
How many cups of coffee does the average American drink per day?
The average US coffee drinker consumes 2.8 cups per day — over 500 million cups nationally. 60% drink 1–2 cups, 36% drink 3–5, and 4% drink 6+.
Do most people drink coffee at home or at cafés?
At home, by a wide margin. 82% of past-day coffee drinkers brewed at home in 2026, while only 28% had coffee prepared away from home.
How much does the average American spend on coffee per year?
The average American spends ~$325/year on coffee. The US coffee industry generates ~$85B in annual revenue and contributes ~$343B to the US economy.
Is Gen Z drinking less coffee than older generations?
Yes. 63% of Gen Z don't drink coffee at all — nearly double Millennials' 33% abstention rate. But those who do drink coffee skew heavily toward specialty and cold formats.
What These Coffee Consumption Statistics Actually Mean
Let me pull the threads together. Because individual numbers are interesting, but the pattern is the real story.
Three takeaways.
Home brewing won. 82% brew at home. That number has held since 2022 and shows no sign of reverting. The equipment market, the bean market, the online roaster — all of it benefits from a structural shift that isn't going back.
Specialty is the future, not the niche. It just beat traditional coffee in past-day consumption. For the first time in the 76-year history of NCA tracking. That's not a trend. That's a tectonic shift.
The growth isn't slowing. Global demand set a record. The US hit a 20-year high. Emerging markets are just getting started. Younger drinkers, when they do enter the category, choose quality. Every arrow points up.
If you brew at home, roast your own, or care about where your coffee comes from — these numbers should make you optimistic. The market is finally moving toward quality. Not because of marketing. Because of what people are actually choosing to drink.
The flavour doesn't lie. And the numbers don't either.
More Recommendations from RoastWorthy Coffee