Coffee Shop Statistics 2026: Market Size, Revenue & Trends

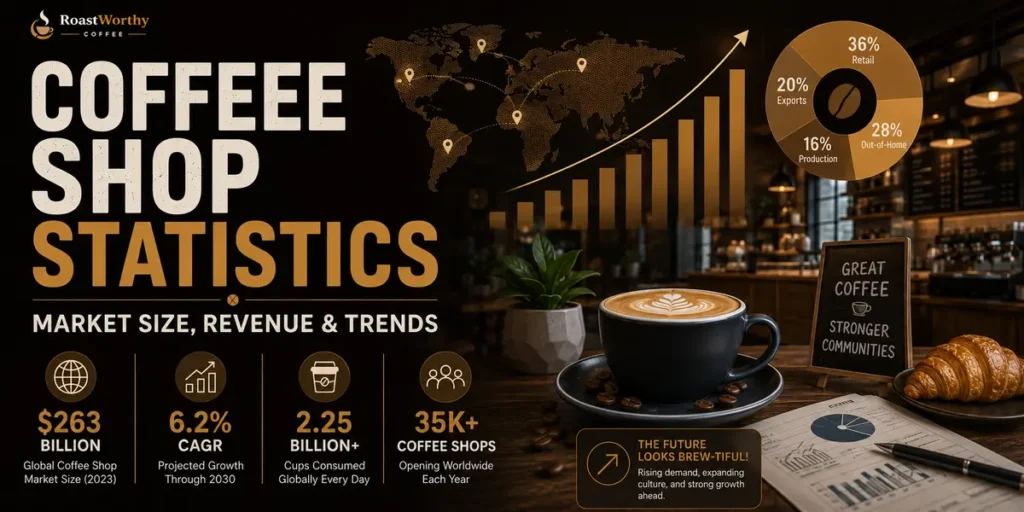
Starbucks closed hundreds of stores in 2025. Peet's shuttered 30 Bay Area locations in January 2026. Meanwhile, independent coffee shops grew 3.2% annually — faster than Starbucks' domestic growth rate.
If you think those two facts contradict each other, they don't. They're the same story told from different ends.
The coffee shop market is valued at $77.97 billion globally in 2026. The US alone has 128,219 coffee shops. And the average ticket at an independent shop just hit $8.47 — up from $7.82 the year before.
People aren't abandoning coffee shops. They're choosing different ones. ☕
Coffee Shop Statistics: Key Takeaways for Owners
If you're running a café in 2026, here's what the data says you should do.
How Many Coffee Shops Are in the US? (2026 Statistics)
Let's start with the count. Because the numbers vary depending on who's counting and how they define a “coffee shop.”
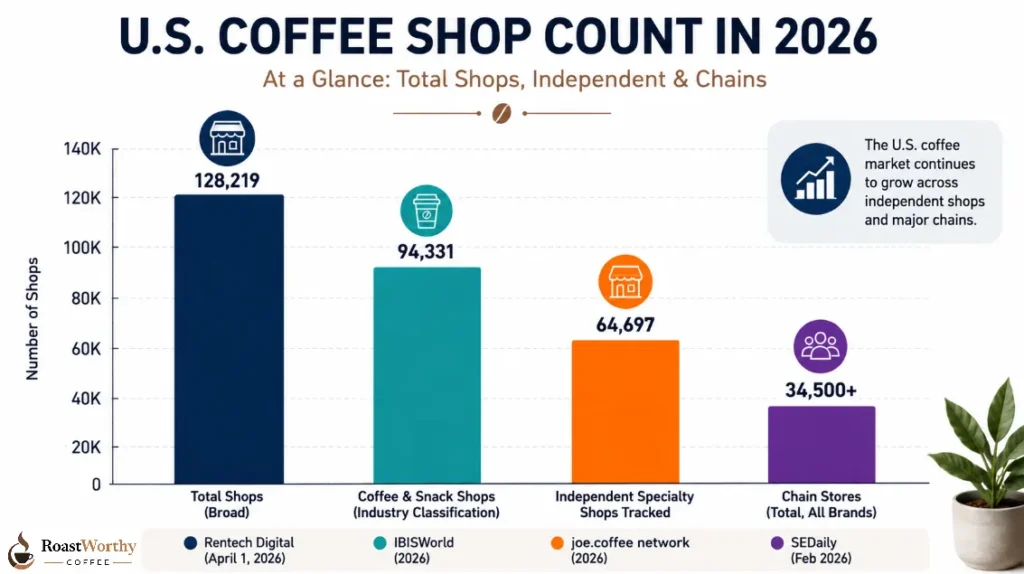
IBISWorld tracks Coffee & Snack Shops as an industry classification and puts the US total at 94,331 businesses in 2026 — a 3.4% increase from 2025.
Rentech Digital's location database, which casts a wider net including unregistered and smaller operations, counted 128,219 coffee shops in the United States as of April 1, 2026.
The joe.coffee network — which tracks real transaction data from 64,697 independent shops — reports that over 60% of specialty coffee locations in America are independently owned.
| Metric | Figure | Source |
|---|---|---|
| Total US coffee shops (broad) | 128,219 | Rentech Digital, April 2026 |
| Coffee & Snack Shops (industry classification) | 94,331 | IBISWorld, 2026 |
| Independent specialty shops tracked | 64,697 | joe.coffee network, 2026 |
| US chain stores (total, all brands) | 34,500+ | SEDaily, Feb 2026 |
The chain number — 34,500+ — has grown 19% over the past six years. But independents still outnumber chains nearly two-to-one when you count every shop, not just branded locations.
Coffee Shop Market Size 2026: $77.97 Billion and Growing
The global coffee shop market was valued at $77.97 billion in 2026 and is forecast to reach $128.4 billion by 2035, growing at a 5.7% CAGR according to Global Growth Insights.
Business Research Insights projects a slightly lower figure — $81.08 billion in 2026, reaching $128.7 billion by 2035 at 5.3% CAGR.
Maximize Market Research takes the broadest view: $290.23 billion by 2032 at 3.5% CAGR. Their number likely includes all café-adjacent foodservice revenue, not just coffee-specific sales.
| Source | 2026 Valuation | Forecast | CAGR |
|---|---|---|---|
| Global Growth Insights | $77.97B | $128.4B by 2035 | 5.7% |
| Business Research Insights | $81.08B | $128.7B by 2035 | 5.3% |
| Maximize Market Research | — | $290.23B by 2032 | 3.5% |
| Global Market Statistics | $83.14B | $165.51B by 2035 | 7.2% |
The disagreement on the headline number is less important than the trajectory. Every source projects steady growth through the next decade. The café market isn't shrinking. It's reorganizing.
What's driving coffee shop market growth
The growth isn't coming from people drinking substantially more coffee. It's coming from three structural shifts.
Frequency-led consumption: Customers visit more often. A daily regular. An afternoon cold brew. A weekend treat. Average visit frequency is rising even as per-visit spend holds steady.
Franchise economics: Smaller-format drive-thru concepts — 7 Brew, Scooter's Coffee, Dutch Bros — are expanding rapidly with lower build costs and higher throughput than traditional café formats. They're opening in markets Starbucks and Dunkin' don't serve well.
Pricing power: Average ticket at independent shops rose 8.3% year over year — from $7.82 to $8.47. Consumers are paying more per visit. That's inflation partly. But it's also willingness to pay for quality, specialty drinks, and food attachments.
Coffee Shop Revenue Statistics: Average Ticket Size & Daily Earnings
This is the number every café owner wants to know. And it varies wildly based on format, location, and concept.
The joe.coffee network — tracking 64,697 independent shops — reports an average ticket size of $8.47 in 2026. Up from $7.82 in 2025. That's an 8.3% increase in a single year.
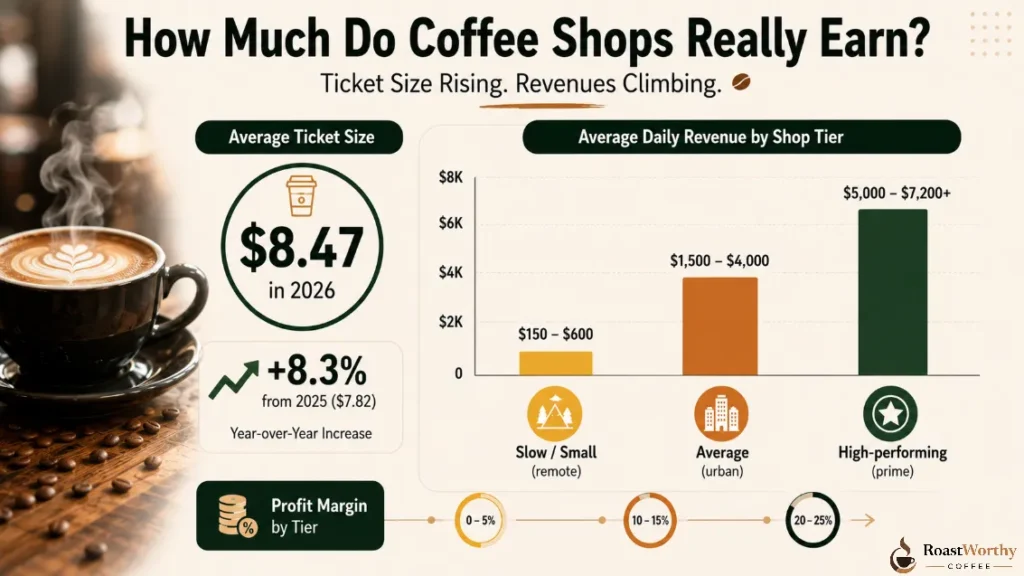
For context, that's significantly higher than the broader QSR average. Coffee shops are premiumizing at the register.
Average Daily Revenue by Shop Tier
| Performance Tier | Daily Customers | Average Ticket | Daily Revenue | Profit Margin |
|---|---|---|---|---|
| Slow / Small (remote) | 40–150 | $4–$6 | $150–$600 | 0–5% |
| Average (urban) | 250–400 | $6–$10 | $1,500–$4,000 | 10–15% |
| High-performing (prime) | 500–600+ | $10–$12+ | $5,000–$7,200 | 20–25% |
A high-performing shop in a prime location can generate $7,200 in daily revenue. That's $2.6 million annually. At a 20–25% margin, that's $520,000–$650,000 in profit.
A slow shop in a remote location might struggle to clear $150 a day. The range is brutal. And it explains why the closure rate for underperforming shops is climbing.
How food attachments boost ticket size
Pastries account for 30–50% of transactions at well-run shops and add $2–$3 to the average ticket. Sandwiches and lunch items show up in 20–30% of transactions and boost tickets by $3–$5.
Premium coffee upgrades — extra shots, specialty milk, size increases — contribute an additional $1–$2 per enhanced order.
A shop that moves its average ticket from $6 to $8.47 (the independent average) by improving food and upsell programs isn't just earning more per transaction.
It's fundamentally changing its unit economics. An extra $2.47 per ticket across 300 daily transactions is $741 in additional daily revenue. That's $270,000 annually — from upselling alone.
Starbucks vs Dunkin: Coffee Shop Chain Statistics 2026
The two giants still dominate. But the gap is narrowing.
Starbucks Statistics 2026
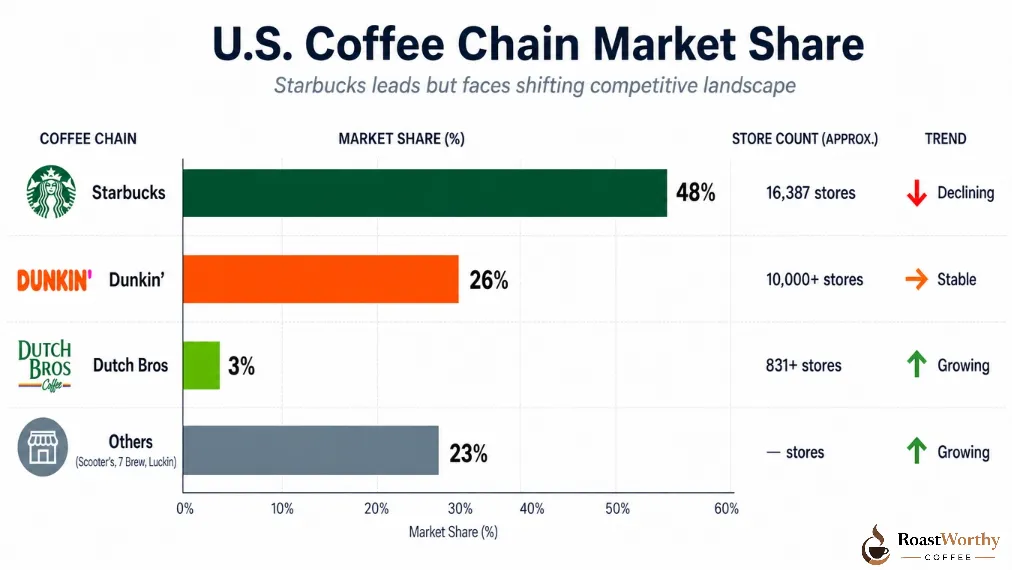
Starbucks operates 16,387 stores in the United States as of June 2026, across all states and territories. Globally, the company has surpassed 41,118 locations.
But Starbucks' US market share — measured by share of coffee shop spending — fell from 52% in 2023 to 48% in 2024 and 2025. That's a 4-percentage-point decline in two years.
In 2025, Starbucks closed hundreds of US stores as part of a $1 billion restructuring initiative led by CEO Brian Niccol. The closures hit major cities hard — 42 locations in New York City alone, approximately 20 in Los Angeles, and additional closures in Minneapolis, Baltimore, and San Francisco.
The company is simultaneously renovating approximately 1,000 stores (10% of its owned outlets) with updated layouts, seating, and power outlets — attempting to revive the “third place” experience that made the brand famous.
Dunkin' Statistics 2026
Dunkin' recently opened its 10,000th US store. The brand holds approximately 26% market share — making it the second-largest coffee chain by a wide margin.
Dunkin's model is different from Starbucks. Lower average ticket. Higher frequency. Drive-thru and value-oriented. It's a different customer with different expectations.
Chain Market Share Breakdown
| Coffee Chain | US Stores | Market Share |
|---|---|---|
| Starbucks | 16,387 | ~48% (declining) |
| Dunkin' | 10,000+ | ~26% |
| Dutch Bros | ~831+ | ~3% (growing) |
| Others (Scooter's, 7 Brew, Luckin, etc.) | — | ~23% (growing fastest) |
The “others” category is where the real growth is happening. Dutch Bros, Scooter's Coffee, and 7 Brew are expanding rapidly with small-format drive-thru concepts. Luckin Coffee — the Chinese chain — is entering the US market and gaining attention.
Together, Starbucks, Dunkin', and JAB Holdings-owned brands comprise roughly 78% of the branded coffee shop segment. But the remaining 22% is growing faster than any individual chain.
Independent Coffee Shop Statistics: Growth, Revenue & Survival
Here's where the data tells a different story than the chain narrative.
Independent coffee shops are growing at 3.2% annually. That's faster than Starbucks' domestic growth rate. The joe.coffee network — which tracks real POS data, not estimates — confirms this with hard transaction numbers across 64,697 shops.
60%+ of specialty coffee locations in the US are independently owned. That's the majority of the premium segment.
Why independents are outpacing chains
Three reasons. And they're not what the chains' quarterly reports will tell you.
Specialty quality gap: A well-run independent with a trained barista, freshly roasted beans, and a curated menu makes better coffee than a chain optimizing for throughput. Customers who care about quality are choosing indie.
Local identity: Independents embed in neighborhoods. They become third spaces. The barista knows your order. The decor reflects the community. Chains try to replicate this with design guidelines. It doesn't land the same way.
Format flexibility: An independent can pivot its menu in a week. Add a matcha program. Launch a cold brew flight. Source a single-origin from a micro-roaster. Chains need months of corporate approval for a menu change. Speed wins.
The survival reality
Not all independents are thriving. The closure data tells a harsher story.
Peet's Coffee — a chain, but one with independent DNA — closed 30 Bay Area locations in early 2026. Starbucks shuttered hundreds of urban stores in 2025. Underperforming independents face the same pressure — rising rents, labor costs, and green coffee prices squeezing margins.
The shops surviving are the ones with diversified revenue. Retail bean sales. Subscription programs. Food attachments. Loyalty systems. The ones depending solely on walk-in drip coffee orders are the ones closing.
Iced Coffee & Cold Drink Statistics in Coffee Shops (2026)
This is the most important ordering shift in the café industry right now. And the numbers are stark.
Iced and cold drinks now account for 38% of coffee shop orders — even in winter. That's not a seasonal pattern. That's a permanent reordering of the menu.
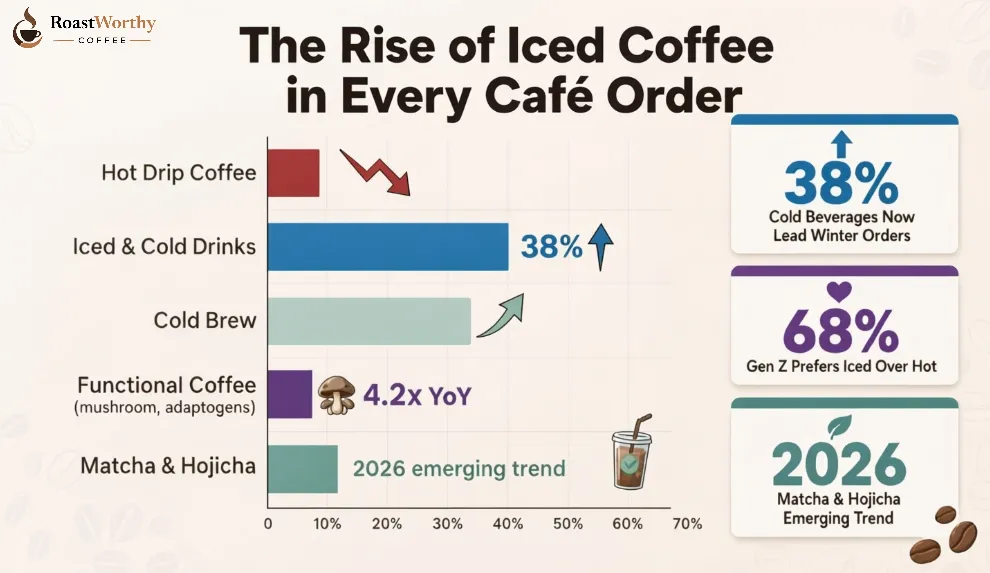
68% of Gen Z consumers prefer cold coffee formats over hot. For this generation, “coffee” increasingly means iced. The hot cup is the exception, not the default.
| Drink Category | Share of Café Orders | Trend |
|---|---|---|
| Hot drip coffee | Declining | Flat to negative |
| Iced/cold drinks (all) | 38% (winter) | Rising year-round |
| Cold brew specifically | Among fastest-growing formats | Structural growth |
| Functional coffee (mushroom, adaptogens) | 4.2x YoY mention growth | Niche but accelerating |
| Matcha/hojicha | Named 2026 trend | Competing category |
What 38% cold drinks in winter actually means
If your shop's prep model assumes hot drinks dominate from November through March, your cold brew tower is sitting idle during your busiest season. That's wasted capacity.
The shops winning right now have year-round cold programs with the same depth as their hot menu. Cold brew on tap. Iced lattes with seasonal flavor profiles. Nitro options. These aren't summer add-ons. They're baseline menu items.
And the growth is in the afternoon and evening daypart specifically. Morning coffee is still hot — 86% of past-day drinkers have their first cup hot, first thing. But the afternoon customer? Increasingly ordering cold.
Coffee Shop Closure Statistics 2026: Who's Shutting Down?
The closure trend is real. But it's selective.
Starbucks closed hundreds of US locations in 2025 as part of its $1 billion restructuring. The company evaluated over 18,000 stores across the US and Canada.
The closures primarily hit underperforming urban sites — locations where remote work had reduced foot traffic and where rent-to-revenue ratios had become unsustainable.
Peet's Coffee closed 30 Bay Area locations in January 2026, following its acquisition by Keurig Dr Pepper. The closures were attributed to “cost synergies” — corporate language for cutting locations that don't fit the portfolio.
What's actually closing vs what's surviving
The pattern across closures — both chain and independent — is consistent.
What's closing:
What's surviving and growing:
The market isn't shrinking. It's bifurcating. Premium specialty and convenience-focused drive-thru are both growing. The middle — mid-price, mid-quality, sit-down urban cafés — is where the closures are concentrated.
Coffee Shop Technology Trends 2026
Technology is splitting the café market along chain-versus-independent lines.
For multi-location operators and chains, IoT-connected equipment is becoming standard. Espresso machines that flag calibration drift. Automated milk steaming systems. Inventory tracking tied to POS data. AI-driven demand forecasting for staffing and prep.
A connected espresso machine that detects a temperature variance before a barista pulls a bad shot protects consistency across 50 locations. For a chain, that's worth the investment.
For independents, the technology story is different. Loyalty apps and subscription platforms are the tools that matter. A shop running a monthly subscription program — pre-paid beans or a daily drink allotment — captures recurring revenue and builds retention against home-brewing competition.
The divergence is clear. Chains invest in equipment for consistency at scale. Independents invest in relationship tools for retention at the local level.
FAQ: Coffee Shop Statistics 2026
How many coffee shops are in the US in 2026?
Approximately 128,219 coffee shops exist in the US as of April 2026 (Rentech Digital). IBISWorld counts 94,331 under a narrower classification. Over 60% of specialty locations are independently owned.
What is the global coffee shop market size in 2026?
The global coffee shop market is valued at $77.97 billion in 2026, projected to reach $128.4 billion by 2035 at 5.7% CAGR (Global Growth Insights). Other estimates range from $81B to $83B.
What is the average ticket size at independent coffee shops?
The average ticket at independent shops is $8.47 in 2026, up 8.3% from $7.82 in 2025. This is based on real POS data from joe.coffee tracking 64,697 shops.
What is Starbucks' US market share in 2026?
Starbucks' US market share fell to 48% in 2024–2025, down from 52% in 2023. The company operates 16,387 US stores and closed hundreds in 2025 under a $1B restructuring.
How fast are independent coffee shops growing?
Independents are growing at 3.2% annually — faster than Starbucks' domestic growth. The joe.coffee network tracks 64,697 independent shops, representing 60%+ of US specialty locations.
What percentage of coffee shop orders are iced or cold drinks?
Iced and cold drinks account for 38% of café orders even in winter. 68% of Gen Z consumers prefer cold formats, making this a year-round structural shift.
How many Starbucks stores closed in 2025?
Starbucks closed hundreds of US locations in 2025 as part of a $1B restructuring — including 42 NYC stores and ~20 in LA. The company simultaneously renovated ~1,000 stores.
What is the average daily revenue of a coffee shop?
Daily revenue varies by tier: slow shops earn $150–$600, average urban shops $1,500–$4,000, and high-performers reach $5,000–$7,200. Profit margins range from 0–5% to 20–25% respectively.
The flavour doesn't lie. And neither does the POS data. ☕✒️
More Recommendations from RoastWorthy Coffee